Faster Click Prediction for Browser Agents at CloudCruise

The internet was built for humans clicking buttons and typing into forms, not for agents trying to navigate it. UIs change between sessions, pop-ups block interactions, and pages can take too long to load. Most approaches have an agent reason through the entire workflow step by step.
CloudCruise takes a different approach, relying on deterministic execution of browser interactions and using LLMs for specific actions and error recovery.
Most models today are proficient at reading the state of a page and interacting with it. Prompt one to click the sign-in button, and it clicks the sign-in button. In that sense, latency isn't the obvious bottleneck for browser agents. Even a slow agent, taking two or three seconds per step, still beats a human doing the same task by hand.
But for CloudCruise, latency matters in the builder agent, which uses LLM assistance to help construct these workflows. Every interaction with the browser during that process is one a human is sitting there waiting on, so anything over a second or two starts to degrade the experience. The step that runs most often in that loop is click prediction, an LLM call that turns a text instruction like click the sign-in button into the coordinates to click. That's the model we set out to optimize.
What we're optimizing
This click-prediction step is one node in a larger workflow, called in from a prior browser execution, a human building out an automation, or an error-recovery process. Because it gets called from so many places, it needs to be fast above all else.
The inputs are a text prompt describing what to click, a screenshot of the current page, and the viewport dimensions. The output is a single set of coordinates, which the next node in the workflow acts on, whether that's a click or a type.
We evaluate this task on two axes.
- center_hit rate: whether the predicted point lands in the central 70% of the target box. This gives some leeway for the production error margin, since a click doesn't need to hit dead center to register.
- Latency: median and P95 response time.
Many of CloudCruise's workflows are in healthcare, so our evaluation data reflects that. We built synthetic EHR portals based on open datasets like HealthAdminBench and publicly available imagery, mixing in other domains like travel, shopping, and ERPs to keep the data varied. Ground truth boxes were pulled from the live DOM at capture time, then discarded, so models only ever see pixels.
We benchmark against Gemini 3 Flash, since that's what powers this click-prediction step in production today. To minimize latency, we set the thinking budget to zero.
Task input and output
Payer portal click
Prompt
Click "Authorization Request"
Screen
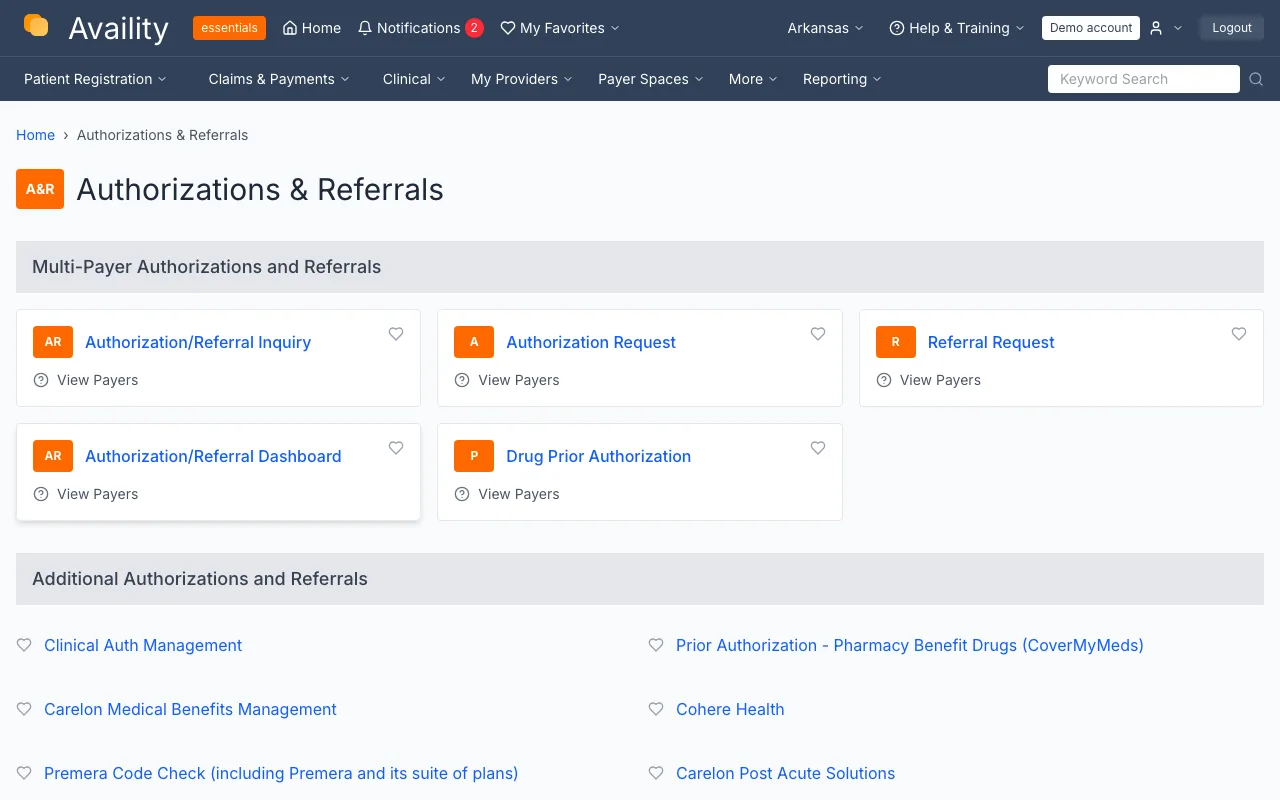
Output
{ "x": 591, "y": 342 }
We benchmarked several models and chose Qwen3.5-9B for its combination of out-of-the-box accuracy and speed.
Group Relative Policy Optimization
We initially train with Group Relative Policy Optimization (GRPO), combined with View-Consistent Self-Verified Training's (VISTA) crop augmentation, which generates multiple zoomed-in variants of each screenshot, and a continuous-reward adaptation of DAPO's dynamic sampling.
Applying GRPO directly to coordinate prediction can cause rollouts from a single screenshot to collapse into all-success or all-failure groups, leaving little signal to learn from.
- VISTA crop augmentation: generates multiple crops of the same screenshot that each keep the target element in view, remapping the ground truth box for each crop. This creates more variation across rollouts for the model to learn from.
- DAPO's dynamic sampling: resamples any group where every rollout gets the same reward, since a zero-variance group produces zero gradient and wastes the update step.
| Model | Center hit | Median | P90 | P95 |
|---|---|---|---|---|
| Kimi K3 | 89.3% | 4.10s | 6.48s | 9.09s |
| Gemini 3 Flash Previewbaseline | 87.6% | 3.75s | 4.17s | 4.29s |
| GLM-5V-Turbo | 80.0% | 2.03s | 2.94s | 3.47s |
| Qwen3.5-9BRL base | 79.6% | 0.28s | 0.42s | 0.44s |
| Qwen3.5-4B | 54.7% | 0.48s | 0.99s | 1.51s |
| Qwen3.7 Plus | 9.3% | 3.78s | 8.37s | 10.4s |
| Qwen3.7 Flash | 4.0% | 3.64s | 5.84s | 6.64s |
Reward
The reward is built from two parts.
- A hit signal: binary, 1 if the predicted point lands in the central 70% of the target box, 0 otherwise.
- A distance signal: continuous, giving partial credit based on how close the point landed even when it misses.
Together they let the model get credit for near misses and for how accurate its coordinates were, rather than treating every attempt as a flat pass or fail.
That continuous element meant DAPO's dynamic sampling as written wouldn't work, since it only drops groups where every rollout scores the same. So we adapted it into a variance-based version, dropping any group where the rewards cluster too tightly together rather than only catching the exact zero or one case.
On-policy self-distillation
GRPO produced marginal gains of 3% accuracy over the base model, so we explored On-Policy Self-Distillation (OPSD) for GUI grounding, inspired by recent research. GRPO can incur high costs from how many rollouts it needs per sample, and sparse rewards mean a lot of those attempts land in groups where every rollout succeeds or fails, ultimately producing no gradient.
We first train the base model with supervised fine-tuning, since out of the box it couldn't reliably format its output or follow the task instruction. OPSD runs from that checkpoint.
OPSD replaces the group with a single rollout scored by a teacher, which is the same model given a visual hint. We dim everything outside the target region rather than handing over the coordinates, so the teacher still has to work out the answer from pixels.
Teacher signal
What the teacher sees
Input screenshot
Full, unmodified render. This is what the student policy sees when it produces the single rollout.
Teacher's hint
Same render, same weights. Everything outside the target region is dimmed, and no coordinates are passed in text.
Coordinates are generated as digit strings, one token at a time, so predicting an x of 514 means producing a 5, then a 1, then a 4. The loss for each of those tokens gets scaled independently before it contributes to the gradient, along two dimensions.
- Position: an error on the leading digit moves the click a hundred pixels, while the same error on the last digit moves it one, so predicting 414 instead of 514 is punished far harder than predicting 513.
- The teacher's confidence: when its distribution over a digit is close to uniform, the weight shrinks so the student isn't pushed to imitate a guess. This matters most on trailing digits, which are least constrained by what the model can see.
Student trajectory
Per-token loss weight
Multiplied together, the gradient concentrates on the digits that both move the click the most and that the teacher is confident about.
Results
| Model | Center hit | P50 | P95 |
|---|---|---|---|
| OPSD | 92.0% | 0.42s | 0.49s |
| Gemini 3 Flash | 87.6% | 3.75s | 4.29s |
| Qwen3.5-9B (base) | 79.6% | 0.28s | 0.44s |
While GRPO achieved a 3% accuracy increase over the base model, OPSD achieved a 12% increase. OPSD matched Gemini 3 Flash on accuracy while still being 9x faster and 5x cheaper on input tokens.
When a workflow depends on a frontier model, teams are stuck choosing between quality, cost, and latency. Open-weight models remove that tradeoff.
Because you own the weights, the data, and the training process, you can tune the model to the exact conditions your product runs in, rather than accepting whatever tradeoff a general-purpose frontier model happens to ship with.
The knowledge of which metric actually matters already exists inside the business. Post-training is what turns it into a model that optimizes for it.